Projective Simulation
  • Get started
  • Documentation
  • Tutorials
  • Research

On this page

  • Example
    • Visualize Memory Filter Performance
  • View source
  • Report an issue

Boxplot Summary


source

simulation_boxplot_summary

def simulation_boxplot_summary(
    data, param1_values, param2_values, title, ylabel, parameter_names:list=['Paramter 1', 'Parameter 2'],
    legend_loc:int=2, legend_cols:int=3, legend_fontsize:int=12
):

data: 3D array, with simulation results. First two dimensions give value of a simulation parameter, third dimension gives the simulation number.


source

plot_heatmap

def plot_heatmap(
    matrix:NDArray[numpy.float64], title:str='Expectation of Memory Traces', xlabel:str='Trace',
    ylabel:str='Time Step', color:str='Blues',
    extent:tuple[float, float, float, float] | None=None, # sets limits of axis coordinats: [left, right, bottom, top]
    figsize:tuple[float, float]=(8, 6), xticks:list[float] | None=None, xtick_labels:list[str] | None=None,
    yticks:list[float] | None=None, ytick_labels:list[str] | None=None,
    ax:matplotlib.axes._axes.Axes | None=None, # optional plt axis to draw plot on
    vmin:float | None=None, # minimum for heatmap colorscale
    vmax:float | None=None, # maximum for heatmap colorscale
    label_scale:float=1.0, # multiplier for label sizes
    colorbar_kwargs:dict[str, typing.Any] | None={}, # arguments to pass to colorbar function
    category_sizes:list[int] | None=None, **kwargs
):

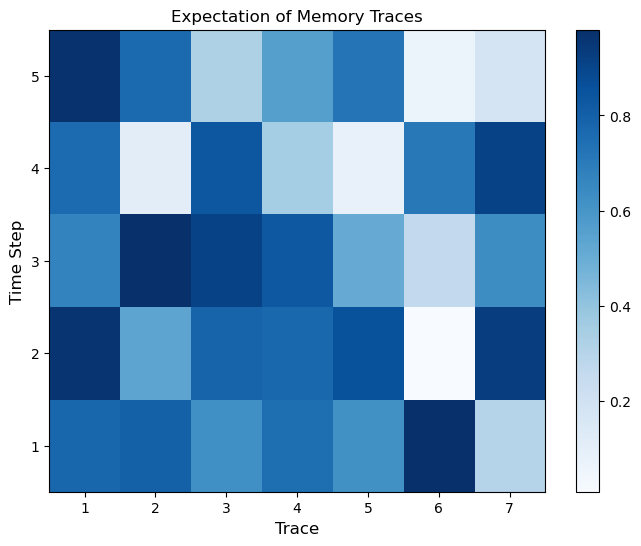
Plots a heatmap of the given matrix using the intensity of a single color, allowing arbitrary colorbar arguments to be passed in as a dictionary.

test_data = np.random.rand(5,7)
plot_heatmap(test_data)

<<<<<<< HEAD


source

visualize_time_step

def visualize_time_step(
    t, observations, m_expectations, s_expectations, actions, surprise_data, H_matrices, glow_matrices,
    reinforcement_data
):

=======

>>>>>>> 'SiPS_5.0'


source

plot_circular_network

def plot_circular_network(
    colors:list, highlight_index:int=None, ax:NoneType=None, figwidth:int=4, node_labels:NoneType=None
)->None:

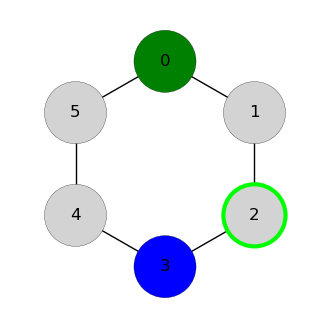
Plot a circular network where each node is colored according to the colors list, and the node at highlight_index has a bright green border.

Example

plot_circular_network(colors = ["green", "lightgrey", "lightgrey", "blue", "lightgrey", "lightgrey"], highlight_index = 2, figwidth = 4)

<<<<<<< HEAD

from matplotlib.colors import ListedColormap

def plot_percepts( percepts, colormap, ax=None, figsize=(2, 8), tick_fontsize=10, label_fontsize=12, title_fontsize=14, title=“Percepts”, xticks=None, xtick_labels=None, yticks=None, ytick_labels=None, **imshow_kwargs ): if ax is None: fig, ax = plt.subplots(figsize=figsize) show = True else: fig = ax.figure show = False # Don’t show if plotting to existing axis

T = np.shape(percepts)[0]
n_percept_features = np.shape(percepts)[1]

extent = (0, n_percept_features, T, 0)  # left, right, bottom, top

if colormap is None:
    ax.imshow(percepts, aspect="auto", interpolation='nearest', extent=extent,**imshow_kwargs)
else:
    cmap = ListedColormap(colormap)
    ax.imshow(percepts, cmap=cmap, aspect="auto", interpolation='nearest', vmin=0, vmax=len(colormap)-1, extent=extent,**imshow_kwargs)

ax.set_title(title, fontsize=title_fontsize)
ax.set_ylabel("Time Step", fontsize=label_fontsize)
ax.invert_yaxis()

if xticks is not None:
    ax.set_xticks(xticks)
    ax.set_xlabel("Feature", fontsize=label_fontsize)
    if xtick_labels is not None:
        ax.set_xticklabels(xtick_labels, fontsize=tick_fontsize)
else:
    ax.set_xticks([])

if yticks is None:
    yticks = np.arange(T)
    ax.set_yticks(yticks + 0.5)
    # Use np.linspace to select at most 5 tick labels if ncols > 10
    if ytick_labels is None:
        if T > 10:
            idxs = np.linspace(0, T - 1, num=5, dtype=int)
            ytick_labels = [str(i+1) if i in idxs else "" for i in yticks]
        else:
            ytick_labels = [str(i+1) for i in yticks]
    ax.set_yticklabels(ytick_labels, fontsize=tick_fontsize)
else:
    ax.set_yticks(yticks)
    if ytick_labels is not None:
        ax.set_yticklabels(ytick_labels, fontsize=tick_fontsize)

if show:
    plt.show()
else:
    return ax
=======

Visualize Memory Filter Performance


source

plot_percepts

def plot_percepts(
    percepts, colormap, ax:NoneType=None, figsize:tuple=(2, 8), tick_fontsize:int=10, label_fontsize:int=12,
    title_fontsize:int=14, title:str='Percepts', xticks:NoneType=None, xtick_labels:NoneType=None,
    yticks:NoneType=None, ytick_labels:NoneType=None, **imshow_kwargs
):

>>>>>>> 'SiPS_5.0'

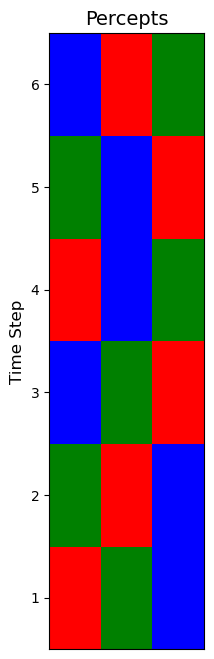
percepts = np.array([[0,1,2],[1,0,2],[2,1,0],[0,2,1],[1,2,0],[2,0,1]])
colormap = ['red', 'green', 'blue']
plot_percepts(percepts, colormap)


source

plot_surprise_bar

def plot_surprise_bar(
    surprise, T, ax:NoneType=None, stationary_entropy:NoneType=None, predictive_entropy:NoneType=None,
    bar_colors:NoneType=None, yticks:NoneType=None, ytick_labels:NoneType=None, stacked:bool=False,
    barh_kwargs:NoneType=None, **kwargs
):

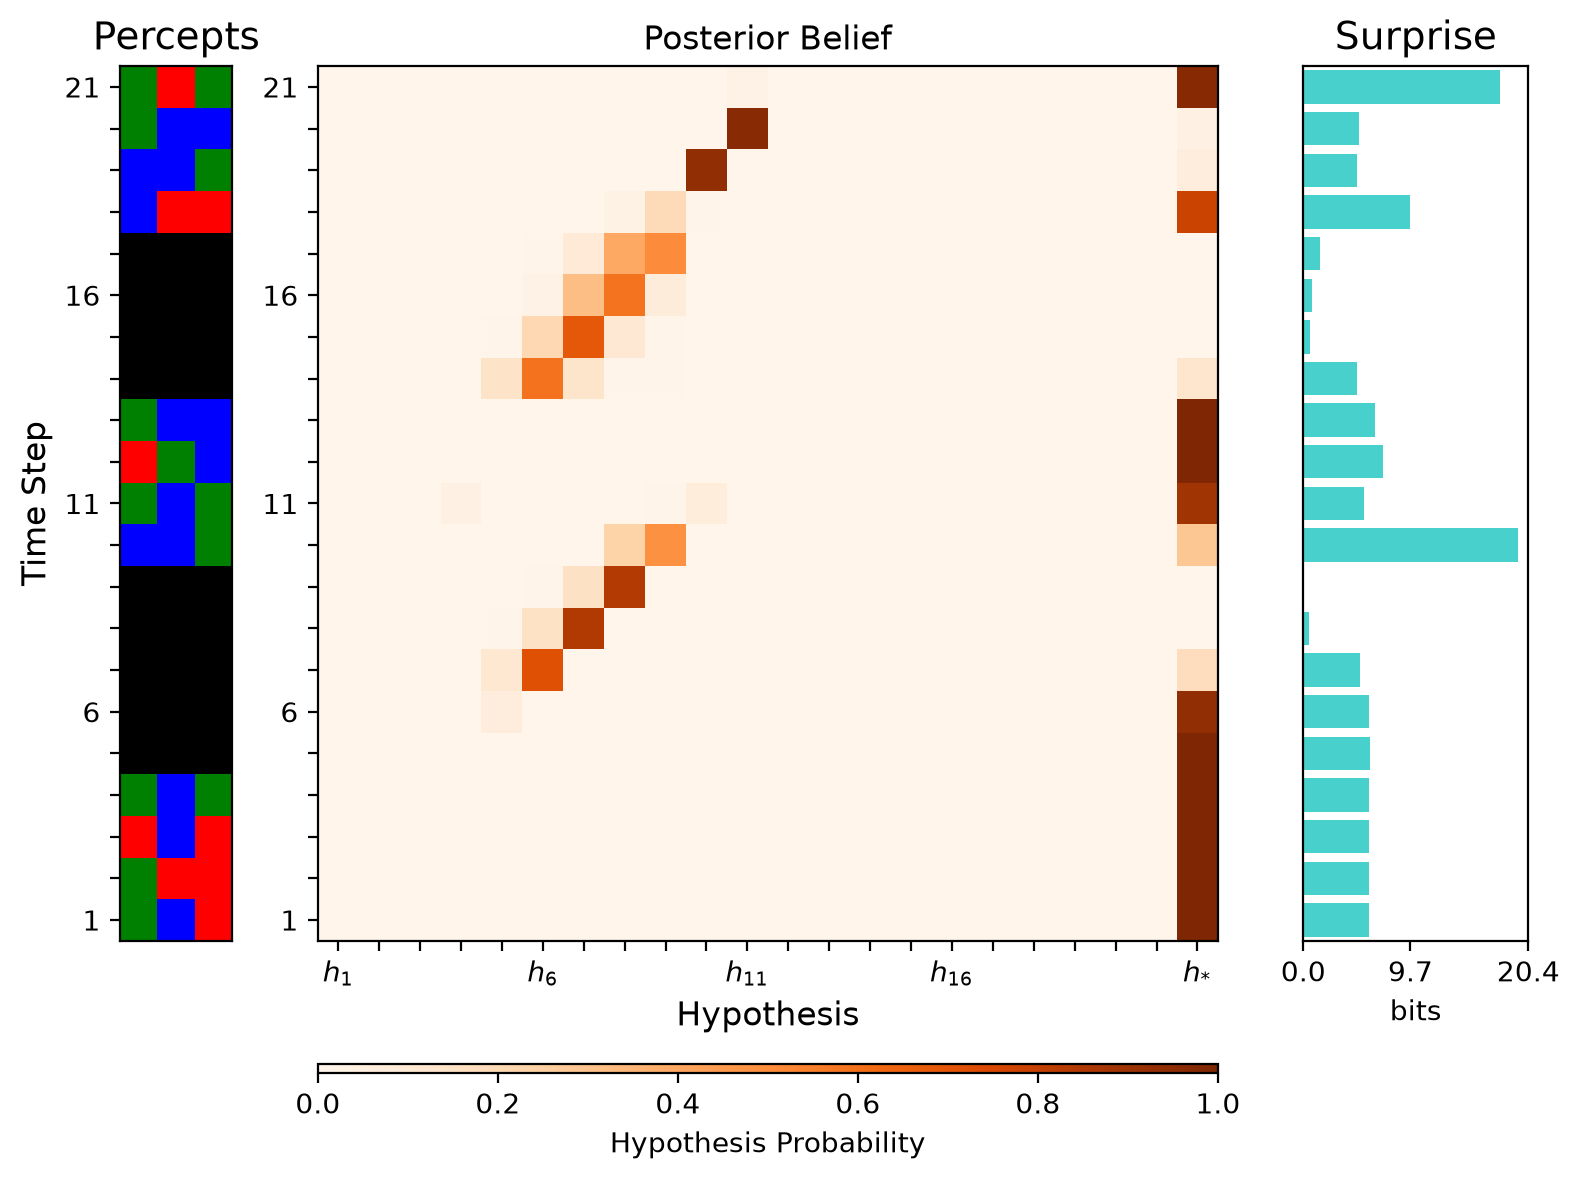
Plot the surprise bar plot for memory filter performance.


source

memory_filter_performance

def memory_filter_performance(
    memory_data:dict[str, typing.Any], observed_percepts:NDArray[numpy.int64],
    colormap:list[str] | NDArray[numpy.str_] | None, stationary_entropy:float | None=None,
    predictive_entropy:float | None=None, stacked:bool=False, bar_colors:list[str] | None=None,
    title:str='Posterior Belief', percept_kwargs:dict[str, typing.Any]=None,
    heatmap_kwargs:dict[str, typing.Any]=None, surprise_kwargs:dict[str, typing.Any]=None, **kwargs
):

<<<<<<< HEAD

=======

from projective_simulation.ECMs.state_estimators import Associative_Memory
from projective_simulation.envs.factorized_POMDPs import List_Sequencer

percept_sequence = List_Sequencer(item_category_size=3,item_size=3,series_length=4, num_series = 3).percept_sequence
trace_network = Associative_Memory(memory_capacity=len(percept_sequence),memory_bias=0.001,fading_rate=0.005,surprise_factor=0.95,consolidation_rate=0.1,reassociation_rate=0.15,reencoding_rate=0.15, category_sizes=[4]*3)
trace_network.prepare_data_storage(data_record=["all"], record_until=len(percept_sequence))
for t in range(len(percept_sequence)):
    trace_network.sample(percept_sequence[t])
memory_filter_performance(trace_network.data_dic, percept_sequence, colormap = ['black', 'green', 'blue', 'red'], surprise_kwargs={"ytick_overide":True})
No stationary_expectations given, using uniform distributions for all sensors

>>>>>>> 'SiPS_5.0'

  • View source
  • Report an issue