Projective Simulation
  • Get started
  • Documentation
  • Tutorials
  • Research

On this page

  • Logistic
  • Exponentiated Shift
  • Decay toward uniform
  • Decay toward uniform
    • Example
    • Decay Toward Stationary
    • Logit Bias
      • Example
  • View source
  • Report an issue

Softmax

Logistic

Exponentiated Shift

Decay toward uniform

Decay toward uniform


source

decay_toward_uniform

def decay_toward_uniform(
    pmfs:numpy.ndarray, alphas:numpy.ndarray
)->numpy.ndarray:

Apply decay toward uniform distribution for each row of a batch of PMFs, with a potentially different alpha per column.

Args: pmfs: Array of shape (K, N), where each column is a PMF summing to 1. alphas: Array of shape (N,), or scalar in shape (1,) or (), each alpha ∈ [0, 1].

Returns: Array of shape (K, N), where each column is decayed toward uniform.
Example

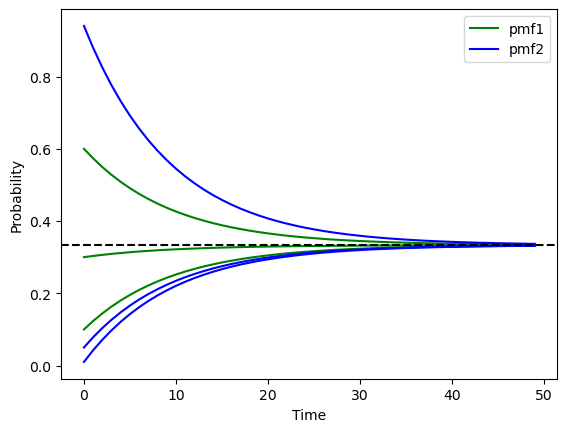
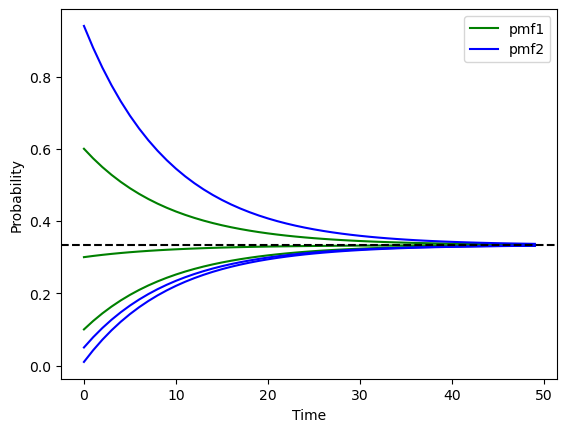
Two probability mass functions decay toward a uniform probability mass function at a rate of 0.1 over 50 time steps

import matplotlib.pyplot as plt
probability_mass_function1 = np.array((0.1,0.3,0.6))
probability_mass_function2 = np.array((0.01,0.05,0.94))
pmfs = np.row_stack((probability_mass_function1,probability_mass_function2))
time_steps = 50
decay_rate = 0.1
pmfs_time_evolution = np.zeros((time_steps, *pmfs.shape)) #* unpacks the shape tuple

for t in range(time_steps):
    pmfs_time_evolution[t,:,:] = pmfs
    pmfs = decay_toward_uniform(pmfs, decay_rate)

for i in range(np.shape(pmfs)[0]):
    for j in range(np.shape(pmfs)[1]):
        label = ['pmf1', 'pmf2'][i] if j == 0 else None  # Add label only once per pmf
        plt.plot(range(time_steps), pmfs_time_evolution[:,i,j], color = ["green","blue"][i], label = label)
plt.axhline(y = 1/3, linestyle = '--', color = 'black')
plt.xlabel('Time')
plt.ylabel('Probability')
legend = plt.legend()

Decay Toward Stationary


source

decay_toward_stationary

def decay_toward_stationary(
    pmfs:NDArray[numpy.float64], # Array of shape (N, K) or (K,), where each row sums to 1.
    gammas:NDArray[numpy.float64] | float, # Array of shape (N,), or scalar in shape (1,) or (), each gamma ∈ [0, 1].
    stationary_distribution:NDArray[numpy.float64], # Row vector of shape (K,) (sums to 1) used as the target mix.
)->NDArray[numpy.float64]:

Decay each row-PMF toward a given stationary distribution. Returns: Array of shape (N, K), where each row is mixed with stationary_distribution. new_pmfs = (1 - gamma_i) * pmfs[i, :] + gamma_i * stationary_distribution

probability_mass_function1 = np.array((0.1,0.3,0.6))
probability_mass_function2 = np.array((0.01,0.05,0.94))
pmfs = np.row_stack((probability_mass_function1,probability_mass_function2))
time_steps = 50
decay_rate = 0.1
pmfs_time_evolution = np.zeros((time_steps, *pmfs.shape)) #* unpacks the shape tuple

for t in range(time_steps):
    pmfs_time_evolution[t,:,:] = pmfs
    pmfs = _decay_toward_uniform(pmfs, decay_rate)

for i in range(np.shape(pmfs)[0]):
    for j in range(np.shape(pmfs)[1]):
        label = ['pmf1', 'pmf2'][i] if j == 0 else None  # Add label only once per pmf
        plt.plot(range(time_steps), pmfs_time_evolution[:,i,j], color = ["green","blue"][i], label = label)
plt.axhline(y = 1/3, linestyle = '--', color = 'black')
plt.xlabel('Time')
plt.ylabel('Probability')
legend = plt.legend()

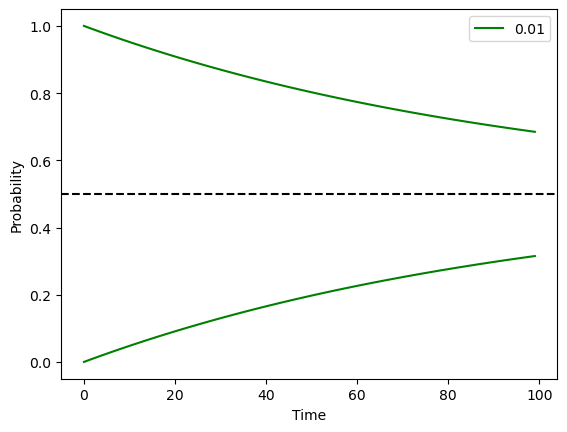
pmf = np.array((0,1))
pmf = pmf[np.newaxis,:]
time_steps = 100
decay_rate = 0.01
pmf_time_evolution = np.zeros((time_steps, *pmf.shape)) #* unpacks the shape tuple

for t in range(time_steps):
    pmf_time_evolution[t,:,:] = pmf
    pmf = _decay_toward_uniform(pmf, decay_rate)

for i in range(np.shape(pmf)[0]):
    for j in range(np.shape(pmf)[1]):
        label = decay_rate if j == 0 else None  # Add label only once per decay rate
        plt.plot(range(time_steps), pmf_time_evolution[:,i,j], color = 'green', label = label)
plt.axhline(y = 1/2, linestyle = '--', color = 'black')
plt.xlabel('Time')
plt.ylabel('Probability')
legend = plt.legend()

Logit Bias


source

logit_bias

def logit_bias(
    rate, bias
):
logit_bias(np.array((0.,0.5,1.)), np.array((-1,0,1))[1])
array([0. , 0.5, 1. ])
_logit_bias(np.array((0.,0.5,1.)), np.array((-1,0,1))[1])

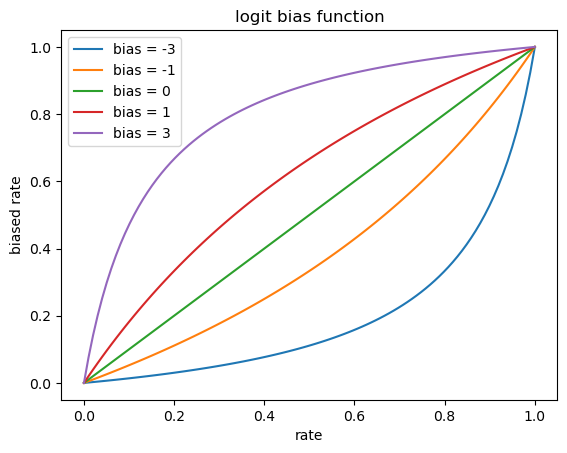
Example

rate_values = np.linspace(0, 1, 100)
bias_values = np.array((-3,-1,0,1,3))

for bias in bias_values:
    biased_rates = logit_bias(rate_values, bias)
    plt.plot(rate_values, biased_rates, label = "bias = " + str(bias))
plt.title('logit bias function')
plt.xlabel('rate')
plt.ylabel('biased rate')
plt.legend();

rate_values = np.linspace(0, 1, 100)
bias_values = np.array((-3,-1,0,1,3))

for bias in bias_values:
    biased_rates = _logit_bias(rate_values, bias)
    plt.plot(rate_values, biased_rates, label = "bias = " + str(bias))
plt.title('logit bias function')
plt.xlabel('rate')
plt.ylabel('biased rate')
plt.legend();

source

uniquify_percept_categories

def uniquify_percept_categories(
    percepts:numpy.ndarray, category_sizes:list
)->numpy.ndarray:

Given an array of percepts, shift the values so that they are unique across different categories.

  • View source
  • Report an issue